Operations Management Suite (OMS): Log Management and Performance Data
Introduction
Log events and performance data have always been an important part of monitoring solutions, and are often the foundation for many system and application monitoring scenarios. With this basic data collected, you can add analytics, intelligence, and advanced presentation features in Operations Management Suite (OMS) to deliver something closer to a proper monitoring solution.
Microsoft has invested heavily in performance data and event collection in the OMS. Microsoft has also invested in how we can present the data once collected and indexed in OMS. We can collect data from both Windows and Linux sources, use data export to Power BI, OMS log search, PowerShell, OMS custom dashboards and alerts to work with the collected data.
In this chapter, we will dive into Windows event log, Windows performance data, IIS logs, Syslog, and Linux performance data. At the end of this chapter, you should have the knowledge to choose the most appropriate mechanisms to manage and collect event and performance data for your infrastructure.
Overview
Figure 1 shows an overview of data flow when working with event and performance data in OMS. Different types of data sources forward data to OMS, which receives the data and stores it in the OMS repository, in a separate storage for each customer and workspace. OMS indexes data within 30 minutes of receipt per the current SLA, at which point we can access the data. On the right-hand side of Figure 1, we can see different ways to access and work with the data. The most basic option is to use Log Search in the OMS portal. All collected data will be stored in the same repository and analyzed together with queries, which make it possible to work with data collected by different sources at the same time.
FIGURE 1. EVENT AND PERFORMANCE DATA FLOW IN OMS
With OMS Log Analytics, you can collect data from Linux computers in much the same way as from Windows computers. You can then review and manage all the data from the OMS portal, which minimize the need to implemental separate Windows and Linux monitoring solutions, making it easier to analyze and work with the collected data. When collecting data from Linux computers you can select to either configure data collection centrally in the OMS portal, or manually on each computer.
Note: To find the latest information about supported Linux versions, see GitHub, https://github.com/Microsoft/OMS-Agent-for-Linux/blob/master/docs/OMS-Agent-for-Linux.md . The OMS Agent for Linux might work on other versions of Linux too, even if they are not officially supported by Microsoft.
Windows Performance counters
Collecting performance data is a key to get insight into hardware components, operating systems, and applications. Performance data can be collected at custom intervals, between every 10 seconds and 1800 seconds (30 minutes).
Note: It is difficult to estimate exactly how much storage performance data will require. But as a rough estimation for a counter collected every 10 seconds about 1 MB per day (24 hours) can be used. The estimated data size = 1 MB x (number of counters) x (number of agents) x (number of counter instances).
To start collecting Windows Performance data, navigate to Settings, Data and click Windows Performance Counters. The first time this page is opened in a OMS workspace there are many suggested performance counters, as shown in Figure 2. By clicking "add the selected performance counters", and then Save, all the suggested performance counters are added to data to be collected. These performance counters provide a good foundation for assessing Windows Server performance.
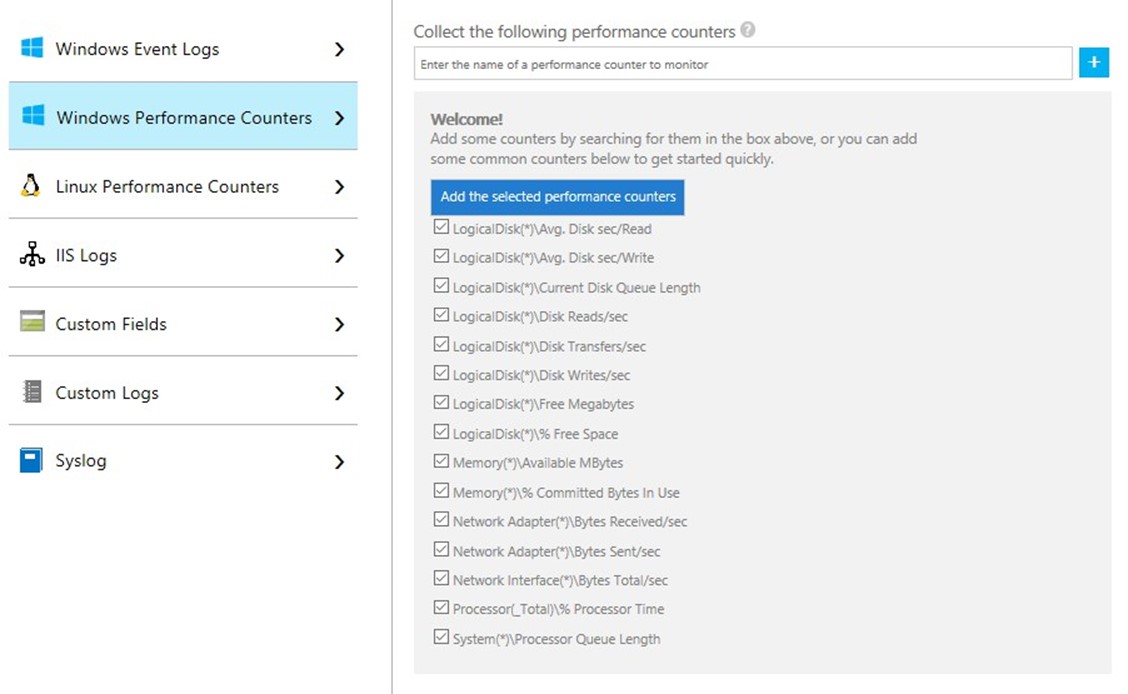
FIGURE 2. START COLLECT WINDOWS PERFORMANCE DATA
It is possible to add more performance counters to collect by typing the name of the counter and then clicking "+", followed by Save. Figure 3 shows that OMS suggests names of performance counters. If you would like to add a counter that is not in the list, type the name and click "+".
FIGURE 3. OMS SUGGEST PERFORMACNE COUNTERS TO ADD
The first time you enable a performance counters collection, it can take up to one hour before the data is visible in the OMS portal. To display performance data, type the following query
Type=Perf
This query will display all collected performance data, both for Windows and Linux servers. There are two categories of views for performance data. In the List view (shown in Figure 4) and the Table view, both will display each entry of performance data.

FIGURE 4. LIST VIEW OF PERFORMANCE DATA
The Metrics view (shown in Figures 5 and 6) which will display a graphical diagram of the collected performance data.

FIGURE 5. METRICS VIEW OF COLLECTED PERFORMANCE DATA
FIGURE 6. DETAILED VIEW OF METRICS
Table 1 provides example queries to display performance data
| Query description | Query |
| All collected performance data | Type=Perf |
| All performance data, show average of % Processor Time per computer | Type:Perf (ObjectName=Processor) CounterName="% Processor Time" InstanceName=_Total | measure avgas(CounterValue) by Computer |
| All performance data, show average of % Processor Time per computer, displayed in a line chart | Type:Perf (ObjectName=Processor) CounterName="% Processor Time" InstanceName=_Total | measure avg(CounterValue) by Computer | display LineChart |
TABLE 1. SAMPLE QUERIES FOR PERFORMANCE DATA
When displaying performance data as a line chart, you can configure the view by clicking on the "wheel" shown in Figure 7 and 8. You can configure unit, scale, min and max values, and Y axis label.
FIGURE 7. LINE CHART SETTINGS
In Figure 8, the unit type is configured as Percentage, the scale is configured, and a custom label is configured on the Y axis.
FIGURE 8. LINE CHART FOR PERFORMANCE DATA
In some scenarios, you need to custom data needs to be inserted into OMS as performance data, for example, the number of files in a queue folder. This can be done with a PowerShell script, as shown in the blog post at http://contoso.se/blog/?p=4334 . The blog post shows how a PowerShell script is used to create a custom performance counter on the local server and then OMS is configured to collect the performance counter.
Windows Events
Windows Event collection is a powerful capability in OMS, as Windows operation system, server roles, and custom applications all write events to Windows Event log. The OMS agent can collect events from all the standard logs, from Application and System, as well as the feature-specific Windows Event Logs beneath the 'Application and Services Logs' folder in the Event Viewer. The OMS agent can also collect from custom application logs. The OMS agent collects and sends events, with only a short delay, to the OMS service. If the OMS agent is offline, the agent will remember the last entry it processed, and pick up where it left off when it is back online. The result is that the OMS agent does not miss any events, assuming the log has not been cleared or overwritten.
To collect Windows events, navigate to Settings, Data and click Windows Events Logs. By default, no events logs are collected. To add an event log to collect, type the name and click "+". In Figure 9 you can see that OMS suggest log names. If OMS does not suggest the log you would like to collect, type the name manually and click "+", and then Save. When adding custom logs, it is important to use the full name of the log.
FIGURE 9. CONFIGURE WINDOWS EVENT COLLECTION
You can find the full name by looking at the properties of the log in Event Viewer, shown in Figure 10.

FIGURE 10. FULL NAME OF WINDOWS EVENT LOG
Figure 11 shows that for each log it is possible to configure which severity to collect. Note that these settings apply to all connected Windows Servers. For example, if OMS is configured to collect WARNING and ERROR events from the Application log, then these events are collected from all connected Windows Servers.
Note: You cannot add the Security Windows Event Log in this interface. Security Event Log processing is only available by adding the Security and Audit solution to your OMS workspace.
FIGURE 11. CONFIGURE WINDOWS EVENTS TO COLLECT
Table 2 shows properties of Windows events collected by default. Figure 12 shows a collected event with all default properties.
Type=Event
| Property Name | Property Description |
| Computer | The agent computer submitted the event |
| EventCategory | Event category |
| EventData | Raw data of all event data |
| EventID | Event number |
| EventLevel | Event severity in numeric format |
| EventLevelName | Event severity in text format |
| EventLog | Name of the event log that the event was collected from |
| ParameterXml | Event parameter values in XML format |
| ManagementGroupName | Name of the management group, for directly connected agents this name starts with AOI- |
| RenderedDescription | Event Description with parameter values |
| Source | Source of the event |
| SourceSystem | Type of system the event was collected from, either Linux, AzureStorage or OpsManager. OpsManager is Windows agent both direct connected and connected through System Center Operations Manager |
| TimeGenerated | Data and time when the event was written in Windows |
| UserName | Name of the user account logged the event |
TABLE 2. PROPERTIES COLLECTED FROM WINDOWS EVENTS
Figure 12 shows the query to list all events collected.
FIGURE 12. WINDOWS EVENT
Table 3 shows sample queries for Windows events.
| Description | Query |
| All collected events data | Type=Event |
| Count number of events based on event severity for the north-app-001 server | Type=Event (Computer="north-app-001") | measure count(EventLevelName) by EventLevelName |
| All error events generated last hour for the north-app-001 server | Type=Event (Computer="north-app-001") TimeGenerated>NOW-1HOURS (EventLevelName=error) |
| Summary of events with severity error based on source | Type=Event EventLevelName=error | Measure count() by Source |
TABLE 3. SAMPLE QUERIES FOR WINDOWS EVENTS
It is difficult to estimate the number of events and bytes sent to OMS when working with events. However, it is possible to review the amount of data sent by looking at the Usage page in the OMS portal. Though every server is different, starting with a subset of servers and events logs can provide some insight into the amount of data and the number of events generated on average in your environment.
IIS logs
OMS has the capacity to collect IIS (Internet Information Services) logs. IIS logs will be collected every 15 minutes and indexed by OMS. If the OMS agent on an IIS server goes offline, then the OMS agent will continue were it last collected data once the agent is online again. IIS log entries created when the agent was offline will be collected as soon as the agent is back online again.
OMS only collects IIS log files stored in the W3C format and does not support custom fields or IIS advanced logging. If there is a requirement to collect custom fields from the IIS log files, then you can use the custom log feature of OMS. With a custom log, the entire log file can be collected and sent to OMS, which will then be indexed with the custom fields feature.
Note: When IIS logging is enabled there should also be a log file cleanup process in place. See https://www.iis.net/learn/manage/provisioning-and-managing-iis/configure-logging-in-iis for information about both IIS log cleanup and IIS log configuration.
To enable IIS Logs collection, navigate to Settings, Data and click the IIS Logs page.
Check the "Collect W3C format IIS log files", as shown in Figure 13, and click Save.
FIGURE 13. ENABLE IIS W3C LOG FILE COLLECTION
Table 4 shows the data collected from the IIS log files. As it stands today, it is not possible to collect more property fields than the properties listed in Table 4.
| Property Name | Property Description |
| Computer | The agent computer submitted the event |
| cIP | IP address of the IIS client |
| csMethod | Request method, for example, GET or POST |
| csReferer | Site that the client followed a link from to the current site |
| csUserAgent | Client browser type |
| csUserName | Name of authenticated user |
| csUriSteam | Request target, for example, a website |
| csUriQuery | Query that the client tried to perform |
| ManagementGroupName | Name of SCOM agent management group |
| RemoteIPCountry | Client IP address country |
| RemoteIPLatitude | Client IP address latitude |
| RemoteIPLongitude | Client IP address longitude |
| scStatus | HTTP Status code |
| scSubStatus | Substatus error code |
| scWin32Status | Windows status code |
| sIP | Web server IP address |
| SourceSystem | OpsMgr |
| sPort | Port on the IIS server that the client connected to |
| sSiteName | Name of the IIS web site |
| TimeGenerated | Date and time when the entry was written to the log file |
| TimeTaken | Request length in milliseconds |
TABLE 4. COLLECTED IIS DATA
The IIS data is data type is W3CIISLog (Type=W3CIISLog), as shown in Figure 14.

FIGURE 14 IIS LOG DATA COLLECTED
Table 5 provides example search queries for IIS log data.
| Description | Query |
| All collected IIS data | Type=W3CIISLog |
| All collected data by country | Type=W3CIISLog | Measure count() by RemoteIPCountry |
| All collected data, count number of request per URL | Type=W3CIISLog | Measure count() by csUriStem |
| For the vnext.se site, display time in milliseconds as a line chart | Type=W3CIISLog sSiteName="Vnext.se" | measure max(TimeTaken) by TimeGenerated | display LineChart |
| For the vnext.se site, display number of events generated as a line chart | Type=W3CIISLog sSiteName="Vnext.se" | measure count() by TimeGenerated | display LineChart |
| For the vnext.se site, count number of unique client IP addresses per country | Type=W3CIISLog sSiteName="Vnext.se" | measure countdistinct(cIP) by RemoteIPCountry |
TABLE 5. SAMPLE QUERIES FOR IIS LOG DATA
Figure 15 shows the last of the sample queries in Table 5, a count of the number of client IP addresses in the IIS log files, grouped per country.

FIGURE 15 COUNT OF VISIT PER COUNTRY
Linux Performance counters
Configuring collection of Linux performance counters is much like configuring collection of Windows server performance data. Navigate to Settings, Data and click Linux Performance Counters to configure performance data collection on Linux servers. The first time this page is open, OMS suggest several performance counters to collect, as shown in Figure 16. These counters provide a solid foundation for assessing server performance at an operating system level, covering the traditional "core four" resource areas: CPU, memory disk and network.
FIGURE 16 CONFIGURE LINUX PERFORMANCE DATA COLLECTION
Click Add the selected performance counters and then Save to start collecting performance data. In Figure 17, you can see that you can configure both instance and sample interval for the different performance counter categories.

FIGURE 17 CONFIGURE INSTANCE AND SAMPLE INTERVAL FOR LINUX PERFORMANCE DATA
To add more performance counters, type the name and then click "+". OMS will suggest performance counter names, just as with Windows servers. Querying for Linux performance data is performed the same way as with Windows servers, using the default performance data query:
Type=Perf
It is possible to build a computer group in OMS with only Linux servers, by using the following query:
OSType=Linux | Distinct Computer
For example, save the query as LinuxComputers. Then run the following query to list performance data from Linux servers only.
Type=Perf Computer IN $ComputerGroups[LinuxComputers]
Syslog
Syslog is perhaps the common log event protocol in Linux. With OMS, it is possible to collect Syslog events from Linux servers and analyze the events together with all other collected data in OMS. When the OMS agent is installed on a Linux machine, the Syslog daemon is configured to forward messages to the locally installed agent. The default syslog configuration, shown in Figure 18, sends all events with severity warning or higher to the agent port, which by default is port 25224. This default syslog configuration can be found in the following files:
- Rsyslog /etc/rsyslog.d/rsyslog-oms.conf
- Syslog-ng /etc/syslog-ng/syslog-ng.conf
Note: With default settings, the OMS agent on a Linux computer receives events from syslog over UDP. If you except the computer to receive many events (for example, in an event forwarding scenario where the computer receives events from other computers and devices.) it is recommended to use TCP transport between syslog daemon and OMS agent. See GitHub for details how to configure this, https://github.com/Microsoft/OMS-Agent-for-Linux/blob/master/docs/OMS-Agent-for-Linux.md
FIGURE 18 SYSLOG CONFIGURATION
If the default settings are too little or too much data, it is possible to configure data collection either in the OMS portal or directly on each agent. New configuration made in the portal will be applied on agents within five minutes. To configure Syslog data collection from the portal, follow these steps
- In the OMS portal, navigate to the Settings page.
- On the Settings page, click Data and then Syslog.
- On the Syslog page, input the name of the facility to monitor and then click +.
- Click Save.
Figure 20 shows the configuration of syslog in the OMS portal, to collect all severity of cron messages, except debug.
FIGURE 19 CONFIGURE SYSLOG TO COLLECT CRON MESSAGES
If you remove your custom Syslog facilities configuration, the OMS Linux agent will not go back to the default configuration shown in Figure 19. Instead, it will keep at least one setting until another setting is applied. For example, if the custom setting in Figure 20 is removed, the configuration will stay active on the Linux agent until another Syslog configuration is applied. The OMS Linux Agent must have at least one Syslog configuration all the time.
Table 6 shows the default properties collected from the syslog
| Property Name | Property Description |
| Computer | The agent computer submitted the event |
| Facility | Part of the system that generated the system, for example, auth, daemon or kern |
| HostIP | IP address of the server that generates the message |
| HostName | Name of the server that generates the message |
| SeverityLevel | Severity level of the event in text format |
| SyslogMessage | Event text message |
| ProcessID | Process ID of the process generated the event |
| ProcessName | Name of the process generated the event |
| SourceSystem | Type of system the event was collected from, either Linux, AzureStorage or OpsManager. OpsManager is Windows agent both direct connected and connected through System Center Operations Manager |
| TimeGenerated | Time and date when the event was submitted to OMS |
| EventTime | Time and date when the event was generated on the source server |
TABLE 6. DEFAULT SYSLOG EVENT PROPERTIES
Table 7 provides example search queries for Syslog data.
| Description | Query |
| All collected Syslog data | Type=Syslog |
| All collected data from the cron facility | Type=Syslog Facility=cron |
| Number of events collected from each syslog server | Type=Syslog | measure count() by Computer |
TABLE 7. SAMPLE SYSLOG QUERIES
Specialized Linux configuration
Figure 20 shows how to configure Syslog data collection from the OMS portal. But in some scenarios, it is a requirement to configure some servers with specialized settings, for example, additional event facilities need to be collected from only a subset of servers. On a Linux server, the following script will disable or enable centralized configuration.
To disable centralized configuration, run the following command: sudo /opt/microsoft/omsconfig/Scripts/OMS_MetaConfigHelper.py –disable To re-enable centralized configuration, run the following command: sudo /opt/microsoft/omsconfig/Scripts/OMS_MetaConfigHelper.py –enable
When you disable central configuration of both performance data and Syslog data collection settings, you must manually configure the data you wish to send to OMS in the files mentioned earlier (rsyslog-oms.conf and syslog-ng.conf). Remember to restart the Syslog daemon after editing the files.
Performance Data is controlled by the /etc/opt/Microsoft/omsagent/conf/omsagent.conf file. It is recommended to make a backup of the central configuration file before starting edit, to ensure you retain a copy with the correct format. Figure 20 shows a portion of an omsagent.conf file.
FIGURE 20 PART OF OMSAGENT.CONF FILE
Summary
In this chapter, we explored configuration of performance and event data collection from both Windows and Linux servers. OMS ability to collect multiple types of data, from multiple types of sources, and analyze all the data together in one graphical interface is a very powerful feature, enabling a variety of monitoring scenarios.
We also explored how we can collect IIS logs from Windows servers and analyze them in the OMS portal. Perhaps most importantly, we have also seen that working with Linux is very similar to configuring the same functionality for Windows and does not require deep Linux expertise to get started.